grafify
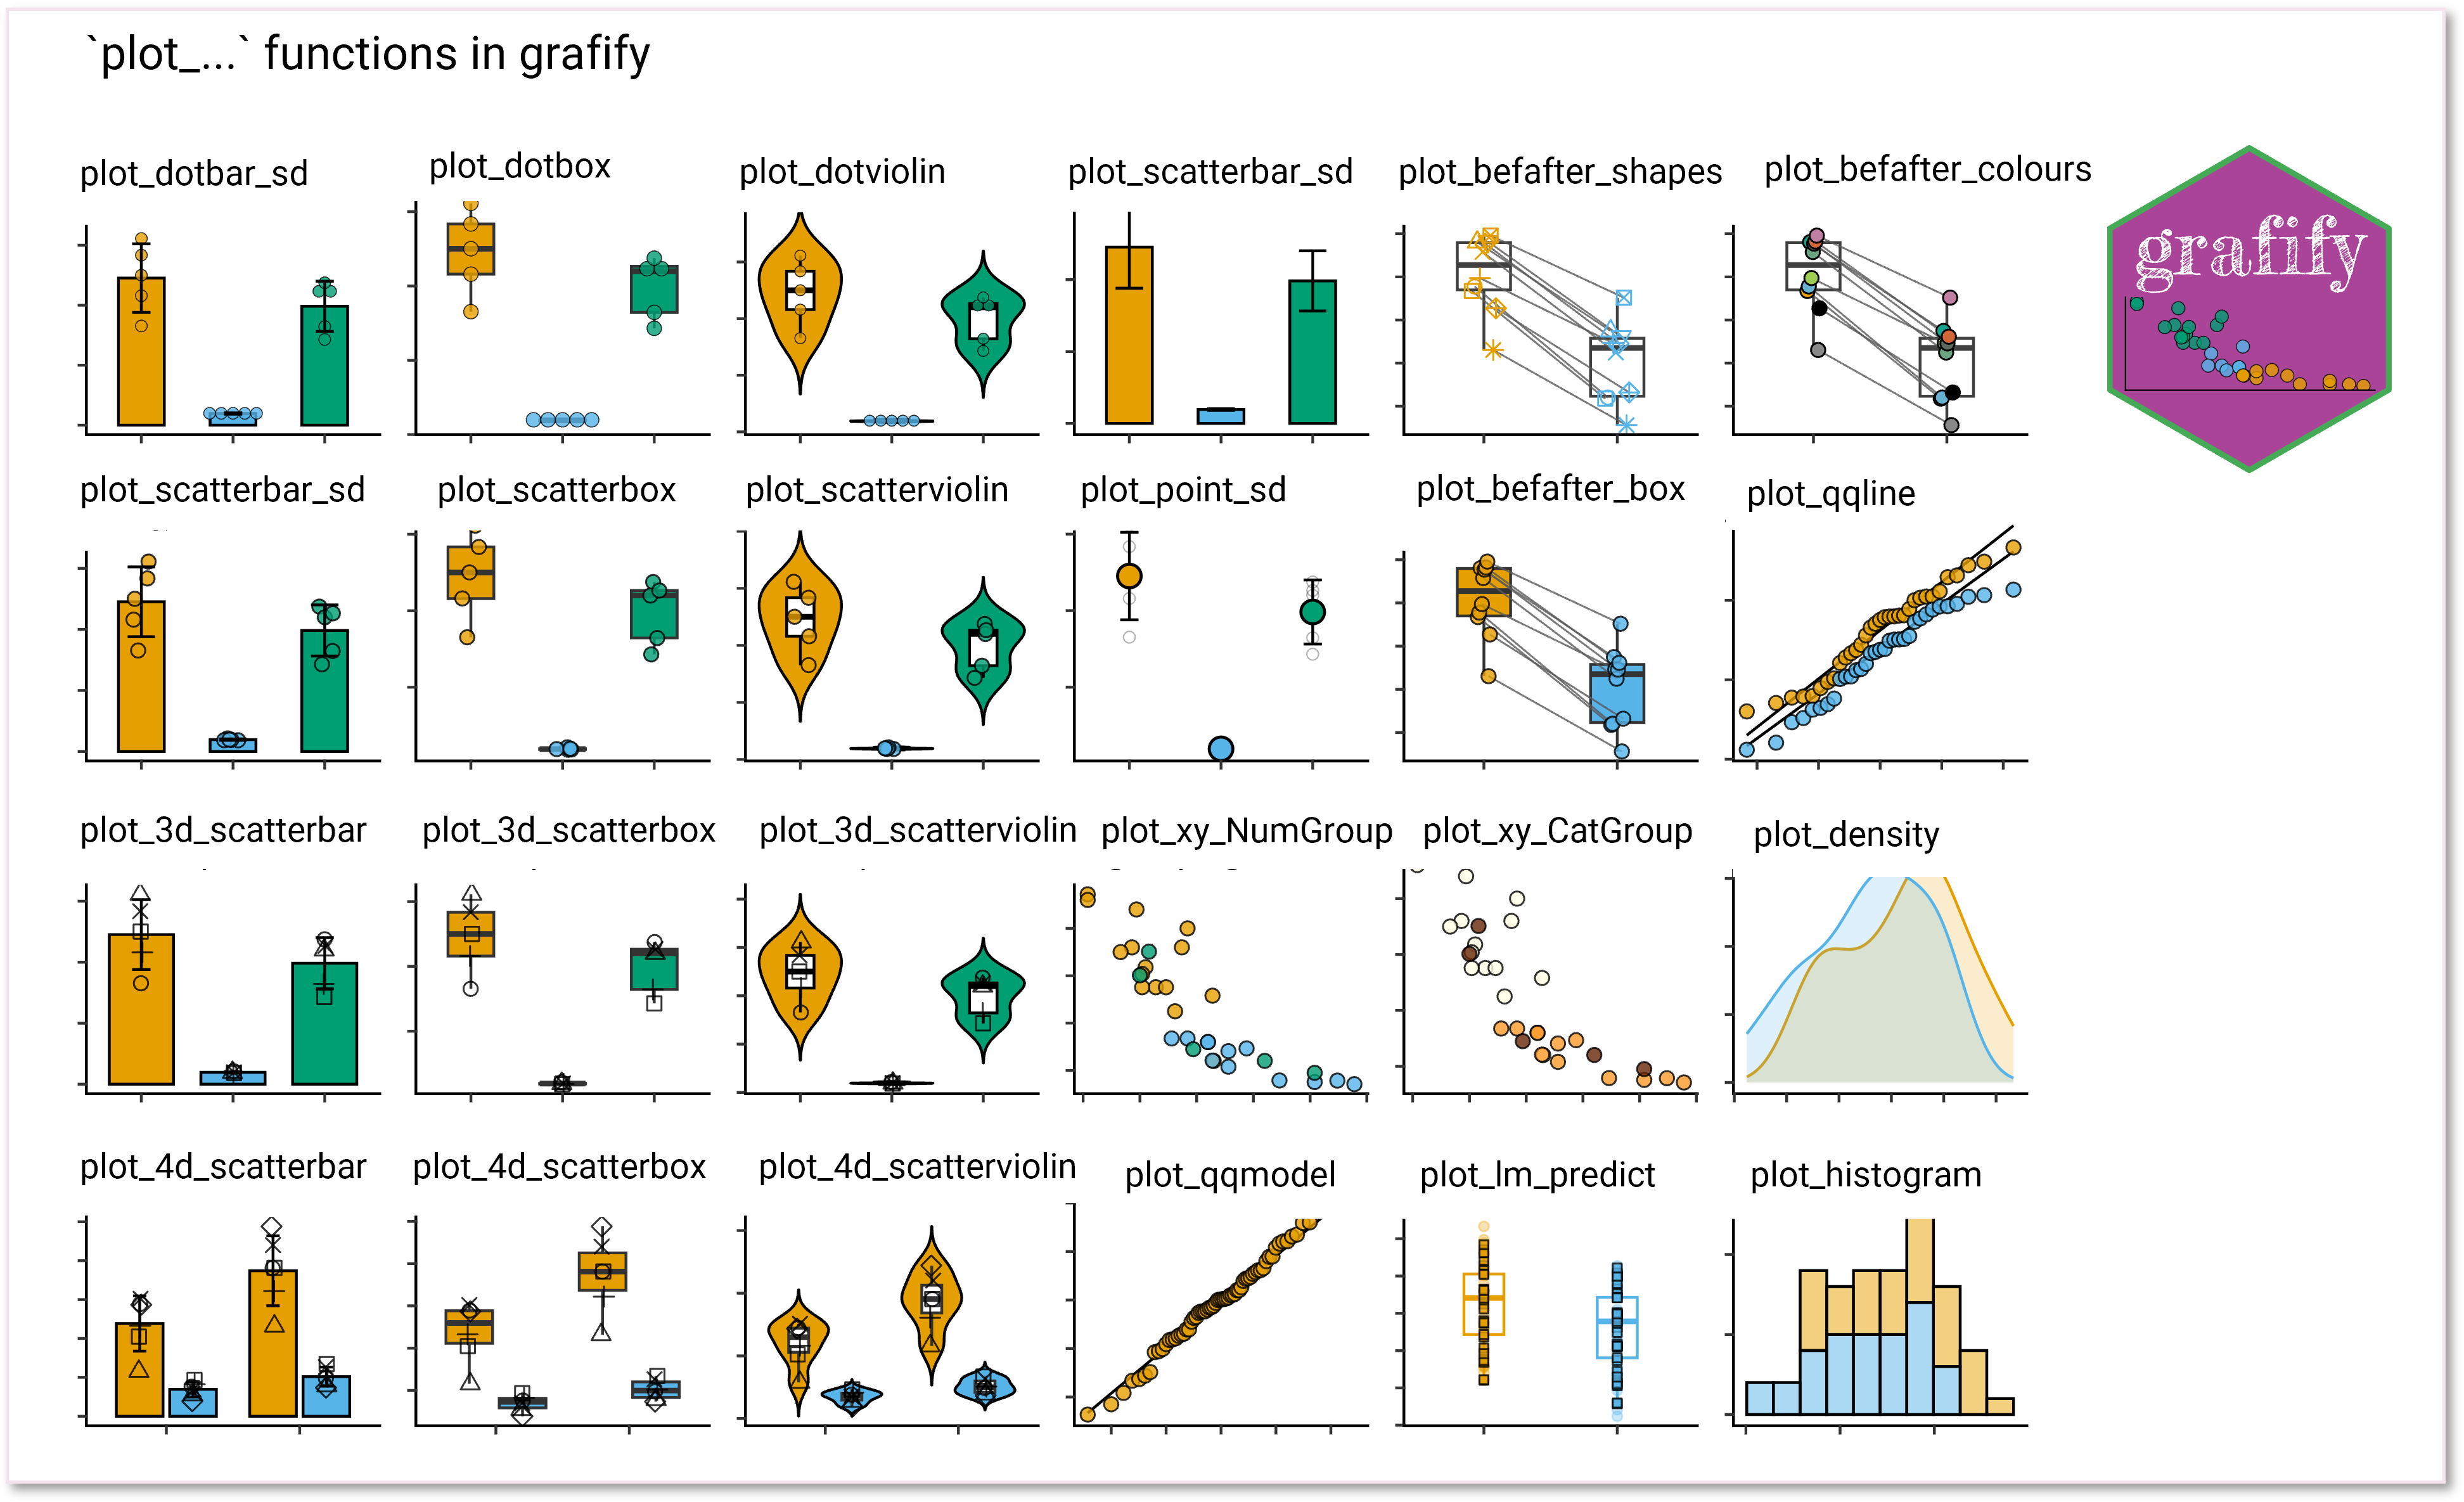
grafify is a package for making attractive publication-ready graphs. grafify can also perform linear mixed effects analyses for ANOVAs and post-hoc comparisons, all with few lines of code.
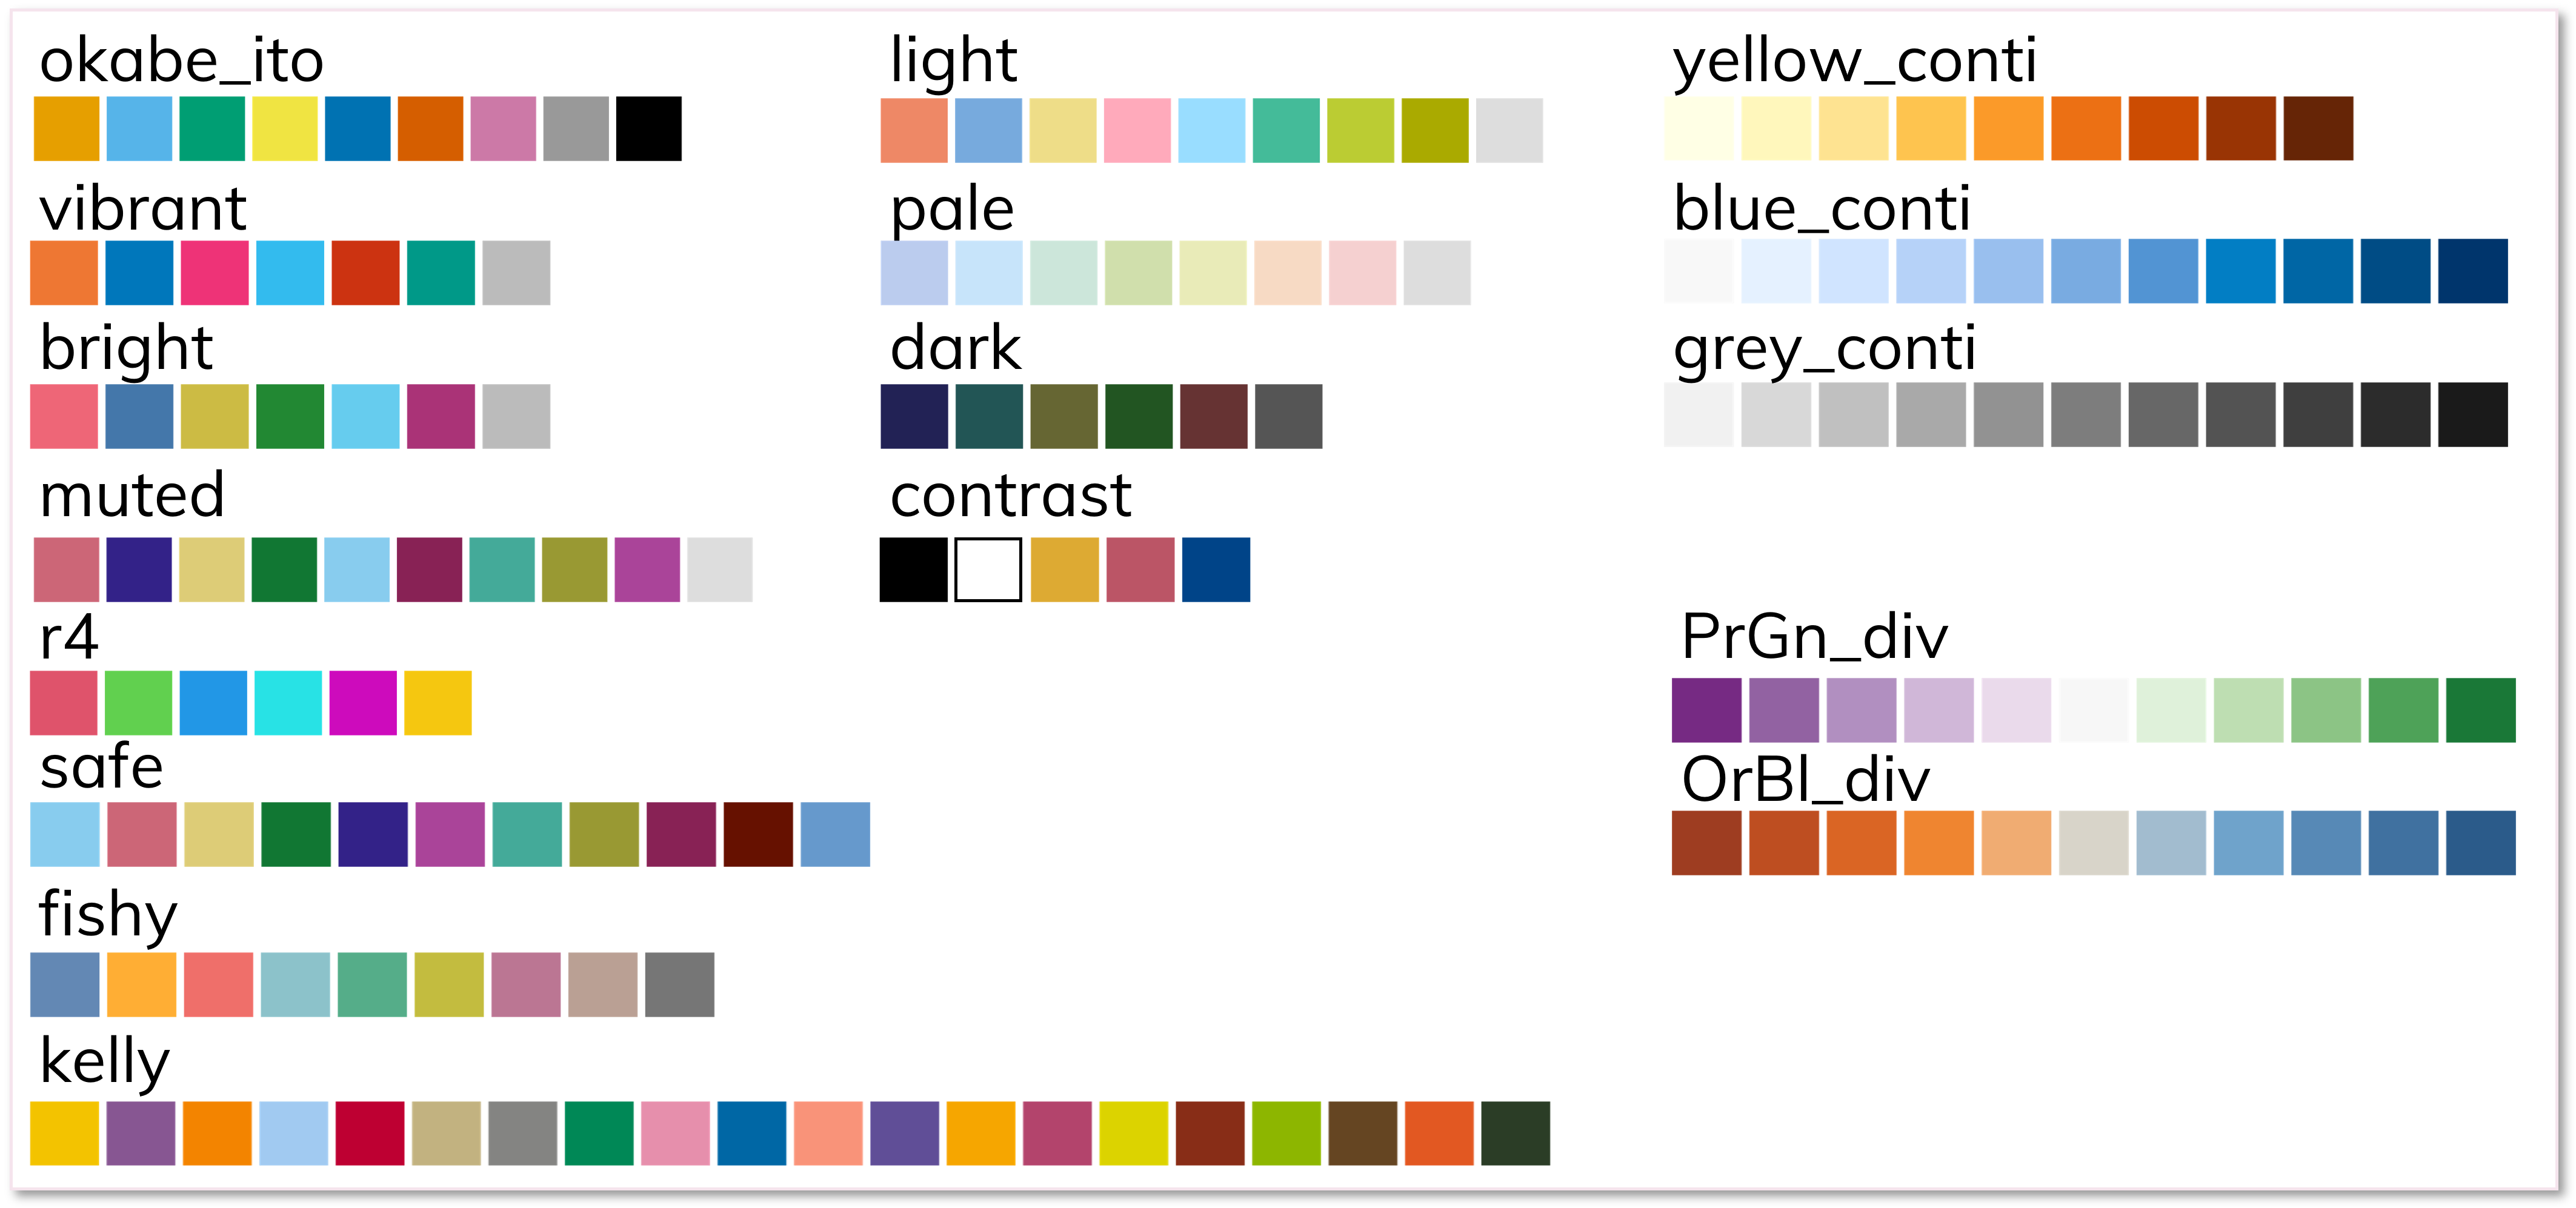
grafify provides uses colourblind-friendly (17 in total). The palettes available for use are shown in the image on right. Usage instructions available at the vignettes website
- 12 colour schemes for categorical plots
- 3 sequential colour schemes for numeric variables
- 2 divergent colour schemes for numeric variables