Shenoy lab
  • Research
  • Teaching
  • grafify and R Stats
    • grafify vignettes
    • grafify online
    • Micro/Immuno Stats
    • R coding workshop
  • People
  • Publications
  • About
    • Imperial Page
    • About this site

Cookies allow us to anonymously count visitor number and usage to improve user experience.

Accept cookies?

grafify

grafify is a package for making attractive publication-ready graphs. grafify can also perform linear mixed effects analyses for ANOVAs and post-hoc comparisons, all with few lines of code.

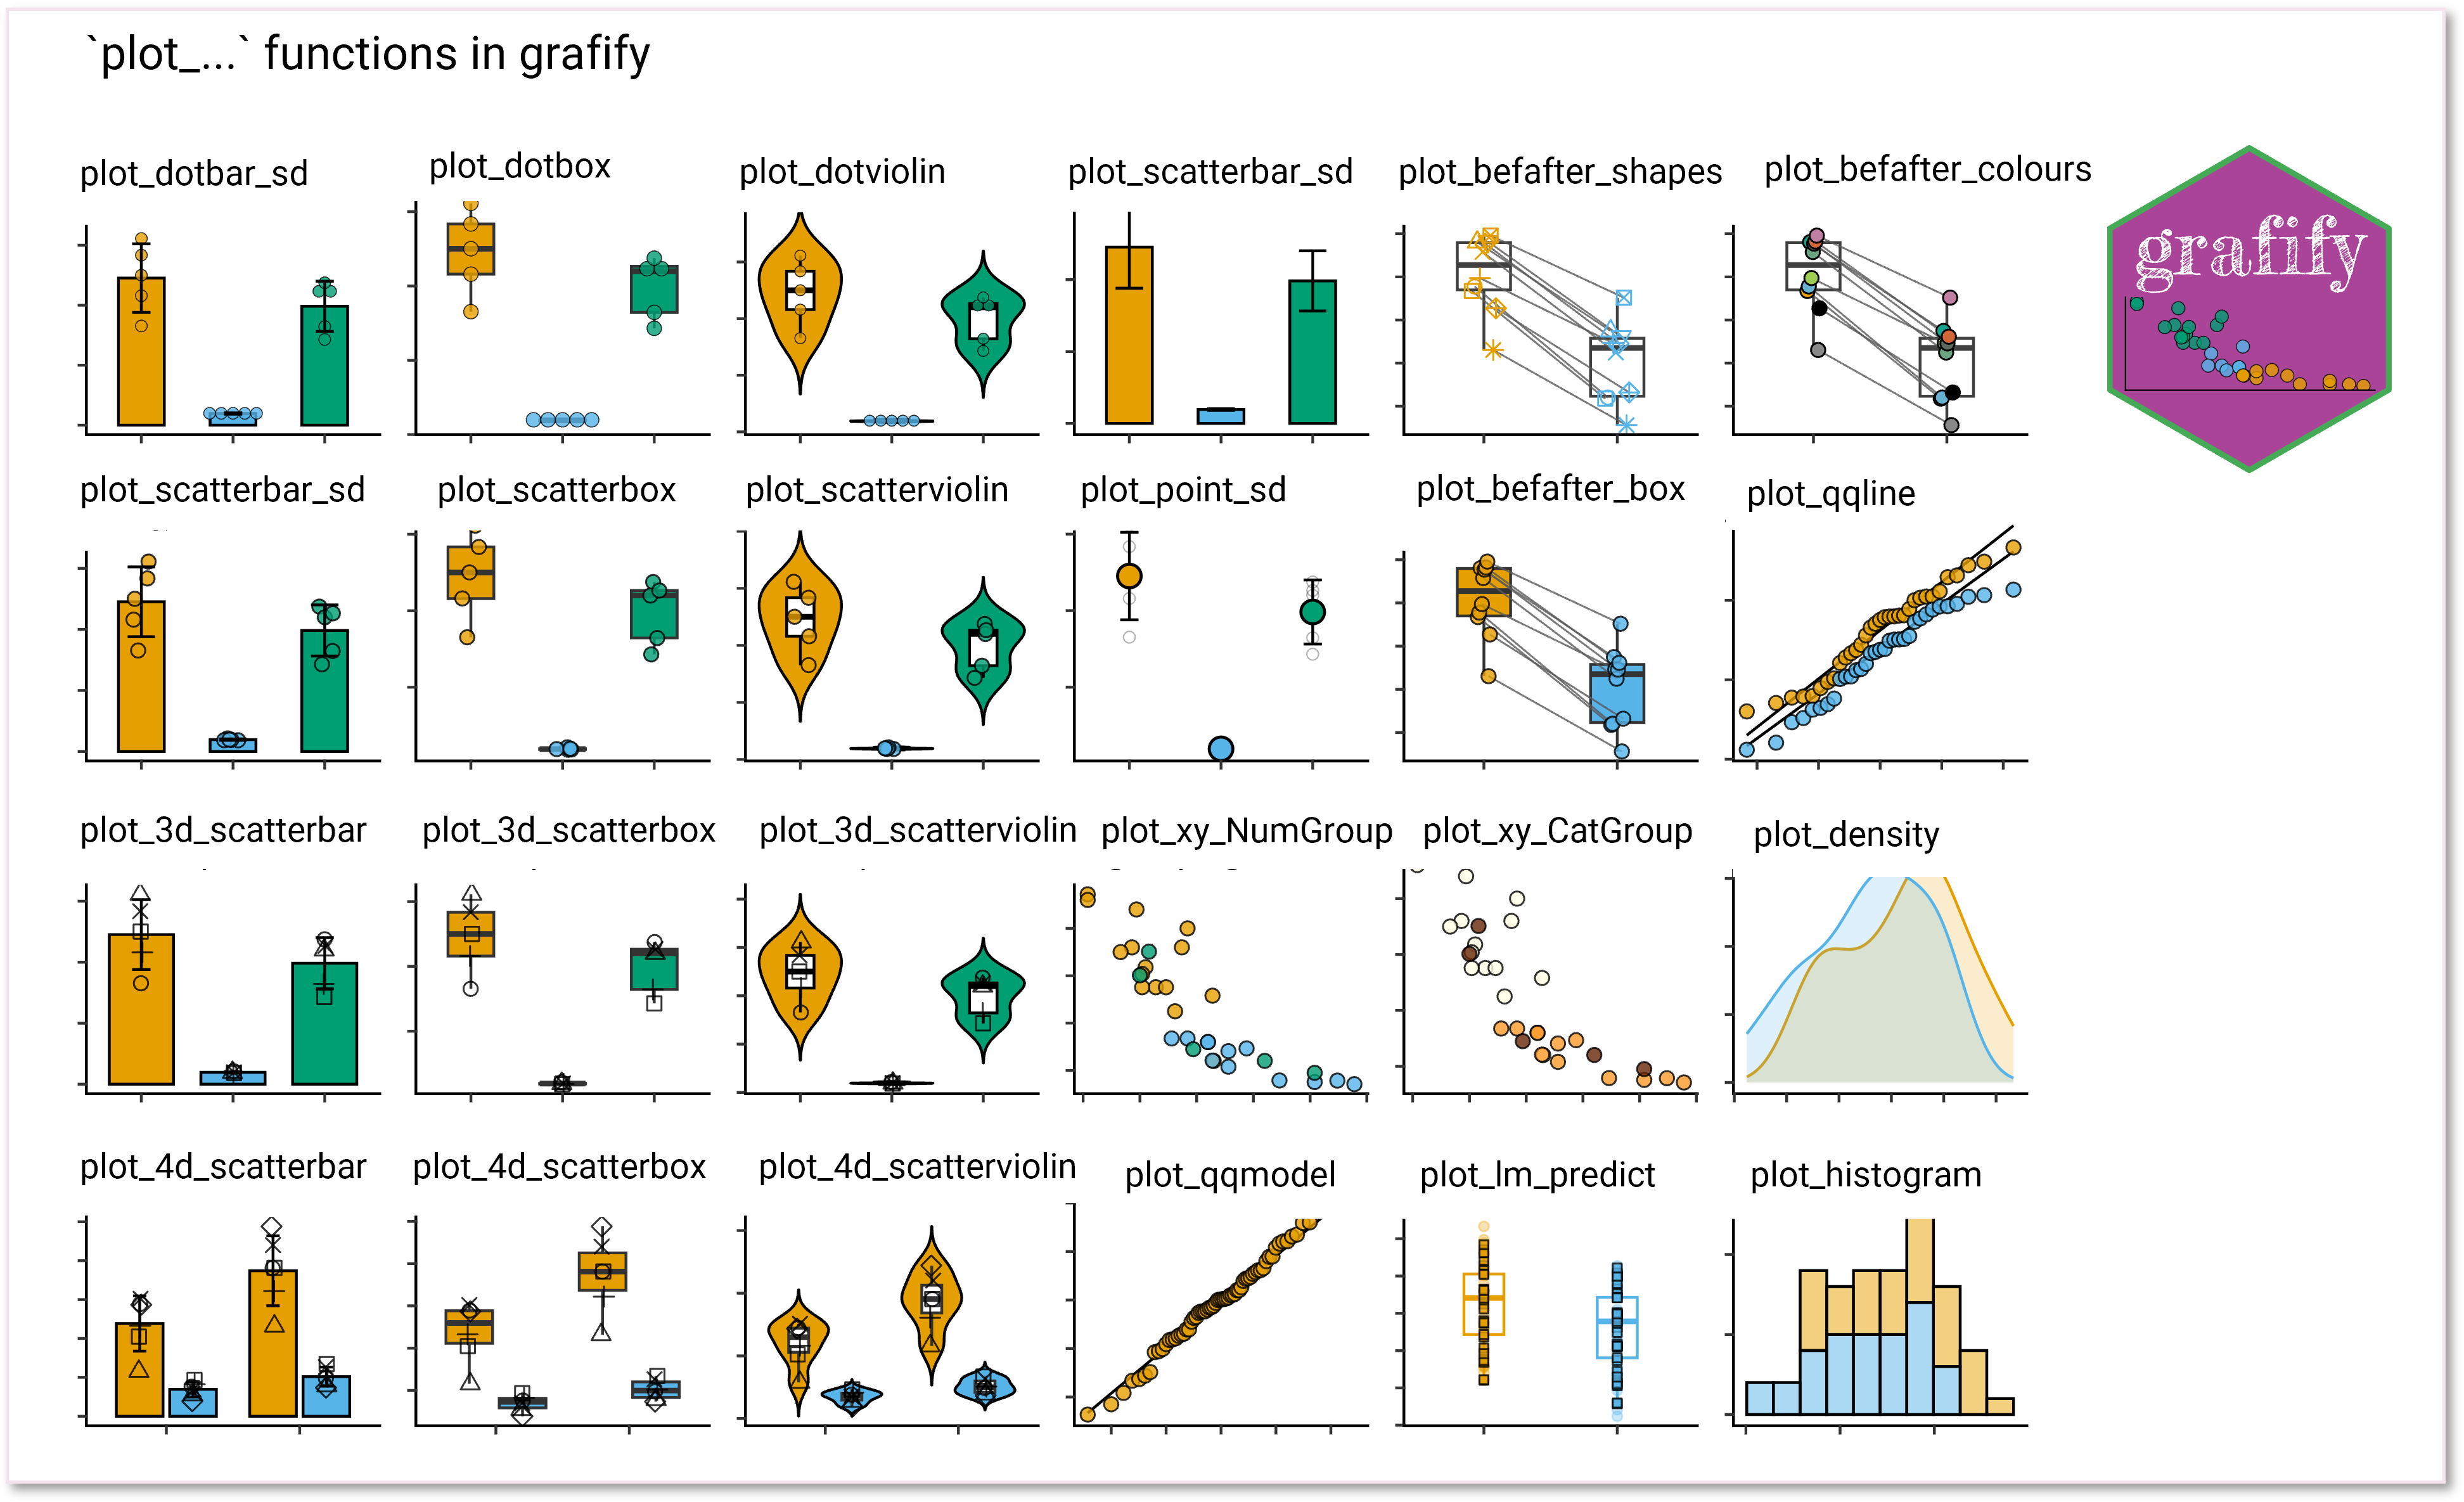
grafify plots great-looking graphs with few lines of code. Plus, sensible defaults make it easy to quickly eyeball data, and save graphs for presentations and manuscripts. grafify uses ggplot2 to produce graphs, which means they can be further edited as necessary in R.

  • Download grafify from
    • CRAN
    • GitHub

grafify is an R package for plotting graphs and performing ANOVA analyses using linear models, including linear mixed effects.

grafify provides uses colourblind-friendly (17 in total). The palettes available for use are shown in the image on right. Usage instructions available at the vignettes website

  • 12 colour schemes for categorical plots
  • 3 sequential colour schemes for numeric variables
  • 2 divergent colour schemes for numeric variables